Saturday 8 December 2012

The effects of flooding in LEDCs and MEDCs


The effects of flooding in LEDCs

Problems faced in LEDCs which make the effects of flooding worse and flood management difficult:
  • Poor quality housing can't withstand flood waters
  • Poor infrastructure is easily damaged with roads, bridges and communications destroyed by flooding
  • Lack of sanitation and clean water supplies resulting in further loss of life during floods through the spread of diseases such as cholera, dysentery etc.
  • Difficult to mobilise rescue teams - lack of funding for training but made more difficult by many areas being isolated during flooding due to damage to infrastucture and inundated by flood waters;
  • Little political co-operation between the neighbouring countries - makes it difficult to reduce flood risks by tackling issues in the headwaters of the major rivers;
  • The country relies on government aid and aid from other countries - with a lack of money many necessary flood defences can not be constructed
  • In order to tackle poverty the government have focused much of their funds on improving exports - again reducing the money available for flood protection.


The effects of flooding in MEDCs

Reasons why the effects of flooding usually less severe in MEDCs and flood protection is better:
  • Homes and possessions are able to be insured against flood damage
  • Good water and sewage systems are in place providing back up supplies of clean water when local supplies become contaminated - means that disease is not the problem it is during flooding in LEDCs;
  • Good infrastructure and communication networks means it is easier to get aid and helpworkers to affected areas increasing survival through rescues and evacuation;
  • Planning restrictions are usually in place to discourage new building of houses on floodplain areas or areas prone to flooding;
  • Governments in MEDCs are able to invest more heavily in flood defence systems - including channelisation projects; the construction of artifical levees and the development of prediction and warning systems.


Friday 7 December 2012

Population distribution and population density


Population distribution

Population distribution means the pattern of where people live. World population distribution is uneven. Places which are sparsely populated contain few people. 

Places which are densely populated contain many people. Sparsely populated areas tend to be difficult places to live. These are usually places with hostile environments (example: Antarctica). Places which are densely populated are habitable environments (example: Europe).

Geographers study population distribution patterns at different scales: local, regional, national, continental and global. Patterns of population distribution tend to be uneven. For example, in the Netherlands there are more people living in the Randstad than in the rest of the Netherlands. 


Population density

Population density is a measurement of the number of people in an area. It is an average number. Population density is calculated by dividing the number of people by area. Population density is usually shown as the number of people per square kilometer.


Population density is calculated using the following formula:

Population density = total population ÷ total land area in km²


The map above illustrates the population density. The darker the colour, the greater the population density.


Factors attracting settlement
  • temperate climate (example: maritime climate)
  • low-lying flat fertile land (example: the Netherlands)
  • good supplies of natural resources (example: building resources)
  • enough drinking water
  • good infrastructure (example: high quality roads and bridges)

Factors discouraging settlement
  • extreme climates (example: arid climate)
  • mountainous or highland areas  (example: the Himalaya mountain range)
  • dense vegetation (example: the Amazon rainforest)
  • too little water (example: drought)
  • poor infrastructure  (example:  need for infrastructure improvement)

Activity at plate boundaries


Type of plate boundary

Description of changes
Earthquake / volcanic activity
Examples
Constructive zone
Two crusts / plates move away from each other.
Moderate volcanic and earthquake activity.
Mid-Atlantic ridge.
Iceland.
Destructive zone
Oceanic crust / plate moves towards continental crust / plate. The oceanic crust is heavier and sinks.
Violent volcanic and earthquake activity.
Nazca and South American plates.
Collision zone
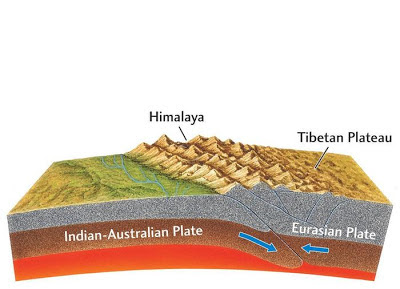
Two continental crusts / plates collide and are forced up into fold mountains.
Earthquake activity, (no volcanic activity).
Indo-Australian and Eurasian plates.
Conservative zone
Two plates move sideways past each other.
Violent earthquake activity (no volcanic activity).
Pacific and North American plates.
San Andreas, California.


Type of plate boundary
Drawing
Constructive zone


Destructive zone


Collision zone

Conservative zone


Thursday 6 December 2012

Corruption perception index

World map of the corruption perceptions index 2012 by the organisation Transparency International. The Corruption Perceptions Index ranks countries based on how corrupt a country’s public sector is perceived to be. Corruption is an abuse of entrusted power. It hurts real people every day.

Transparency International measures the degree to which corruption is perceived to exist among public officials and politicians. 

High numbers (yellow) indicate less perception of corruption, whereas lower numbers (red) an indicate higher perception of corruption.


The corruptions perception index 2012 measures the perceived levels of public sector corruption in 176 countries around the world.


Friday 30 November 2012

Transit airport


If you are traveling from point A to point C, any airport that your plane stops at (point B) for you to get a connecting flight would be your transit airport


A transfer passenger is a traveller who is changing from one plane, train, or bus to another, or to another form of transport.

Tuesday 27 November 2012

Airport Schiphol


Amsterdam Airport Schiphol
Amsterdam Airport Schiphol (Luchthaven Schiphol) is the Netherlands' main international airport, located southwest of Amsterdam, in the municipality of Haarlemmermeer. 


Schiphol is geographically one of the world's lowest major commercial airports. The entire airport is below sea level; the lowest point sits at 3.4 m below sea level, the runways are around 3 metres below Dutch Normaal Amsterdams Peil (NAP).


Schiphol has six runways, one of which is used mainly by general aviation aircraft. The northern end of the Polderbaan, the name of last runway to be constructed, is 7 km north of the control tower, causing lengthy taxi times (up to 20 min) to the terminal. Plans have been made for a seventh runway.


Amsterdam Airport Schiphol contributed significantly to the Dutch economy. By creating jobs, for example: at Schiphol around 62,000 people work for some 500 companies. 
Passengers travelling from, to or via Schiphol contribute € 11 billion to the Dutch economy
and account for a total of 170,000 jobs in the region.


Shareholders
Amsterdam Airport Schiphol shareholders are:
  • State of the Netherlands - 69.8%
  • City of Amsterdam - 20.0%
  • Aéroports de Paris - 8.0%
  • City of Rotterdam - 2.2% 

Airlines
The airport is the primary hub for KLM (Royal Dutch Airlines). Schiphol is KLM’s homebase. Since May 2004, Air France and KLM Royal Dutch Airlines have become the largest European airline group.


The airport also serves as a European hub for Delta Air Lines and as a base for Vueling, Arkefly, Corendon Dutch Airlines and Transavia. 


Schiphol is an important European airport, ranking as Europe’s 4th busiest and the world's 14th busiest by total passenger traffic in 2011. It also ranks as the world’s 6th busiest by international passenger traffic and the world’s 17th largest for cargo tonnage.


  • 43.5 million passengers passed through the airport in 2009.
  • 45.3 million passengers passed through the airport in 2010, a 4% increase compared with 2009.
  • 49.8 million passengers passed through the airport in 2011, a 10% increase compared with 2010).

In 2009, around 67% of passengers using the airport flew to and from Europe, 12% to and from North America and around 9% to and from Asia; cargo volume was mainly between Schiphol and Asia (45%) and North America (16%).


Major European Airports

Schiphol's main competitors in terms of passenger traffic and cargo throughput are London Heathrow, Paris Charles de Gaulle, Frankfurt, Madrid, Rome Fiumicino, Istanbul, Munich, London Gatwick, Barcelona and Paris Orly.

Airport
Passengers (x 1000) in 2011
Change 2010-2011
London Heathrow
69,433
5.4%
Paris Charles de Gaulle
60,971
4.8%
Frankfurt
56,436
6.5%
Amsterdam Schiphol
49,755
10.0%
Madrid
49,671
-0.4%
Munich
37,764
8.8%
Rome Fiumicino
37,652
3.6%
Istanbul
37,395
16.3%
Barcelona
34,399
17.8%
London Gatwick
33,674
7.3%
Paris Orly
27,139
7.7%

Monday 26 November 2012

Middle East and Africa


Climates of the Middle East & Africa.


Population of the Middle East & Africa.


Middle East & Africa: Religion.


Middle East & Africa: Language


Climate


Climate
Climate is defined as the avarage weather conditions at a specific place over a long period. The standard averaging period is 30 years. 
Weather is what the forecasters on the television news predict each day. Weather is elements which we see daily, such as temperature, rain and wind. These can change hour by hour, day by day. Climate on the other hand looks at how the weather changes over a long period of time, typically over 30 years. It can be thought of as the average weather over a long period.


The difference between weather and climate
The difference between weather and climate is a measure of time. Weather is what conditions of the atmosphere are over a short period of time, and climate is the average weather in a place over many years. While the weather can change in just a few hours, climate takes hundreds, thousands, even millions of years to change.


Climate classification system
Scientists (e.g. Wladimir Köppen) have been able to define climate zones around the world. Here in the Netherlands, we have a ‘temperate’ climate that is neither especially hot nor cold, wet nor dry, when compared to other climates. It is a very different climate to that in the Sahara for example, which is known as arid because throughout the year the weather is dry and hot.


Wladimir Köppen (1846-1940), was a Russian-born German climatologist who developed a systematic method of classifying the climates of the world based on long-term patterns of the distribution of temperature and precipitation around 1900. His classification remains the most used climate classification system up to the present day.

Climate and vegetation
The distribution of vegetation is strongly correlated with climate patterns.


Sunday 25 November 2012

Weather forecasting


Weather
Weather is the state of the atmosphere at a given time and at any one place, with respect to heat or cold, wetness or dryness, calm or storm, clearness or cloudiness. Also, weather is the meteorological day-to-day variations of the atmosphere and their effects on life and human activity. It includes temperature, pressure, humidity, clouds, wind, precipitation and fog.


Weather forecasting
The scientific study of weather is termed meteorology. Attempts to predict future changes are known as weather forecasting. Weather forecasting is the application of science and technology to predict the state of the atmosphere for a given location.

Weather forecasts are made by collecting quantitative data about the current state of the atmosphere and using scientific understanding of atmospheric processes to project how the atmosphere will evolve.


Weather station
A weather station is a facility, with instruments and equipment for observing atmospheric conditions to provide information for weather forecasts and to study the weather and climate. 

The measurements taken include: 


  • temperature, 
  • barometric pressure, 
  • humidity, 
  • wind speed, 
  • wind direction, and 
  • precipitation amounts. 


Weather instruments
Typical weather stations have the following instruments:

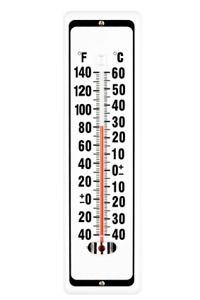
Thermometer for measuring air and sea surface temperature


Barometer for measuring atmospheric pressure


Hygrometer for measuring humidity.


Anemometer for measuring wind speed


Rain gauge for measuring liquid precipitation over a set period of time.


Weather stations often use weather balloons. A weather balloon is a balloon which carries instruments and the balloon sends back information on atmospheric pressure, temperature, humidity and wind speed. 


KNMI
The Royal Dutch Meteorological Institute (KNMI = Koninklijk Nederlands Meteorologisch Instituut) is known mainly for its weather forecasts and warnings, but is also the national knowledge centre for weather, climate research and seismology.


The KNMI was founded on 31 January 1854. Buys Ballot (1817-1890), its first general director, chose to establish KNMI at the Sonnenborgh observatory in Utrecht. In 1897, the Institute moved to De Bilt, where its headquarters is still located today. 


Friday 23 November 2012

Compass directions of the wind - mnemonic

Mnemonic - All compass directions of the wind; north east south west:


  • Never Eat Shreaded Weat
  • Never Eat Slimy Worms
  • Naughty Elephants Spray Water
  • Never Eat Salty Worms
  • Never Eat Soggy Waffles

The Euro zone


The eurozone is an economic and monetary union of 17 European Union member states that have adopted the euro (€) as their common currency and sole legal tender. 


The eurozone currently consists of :


  • Austria, 
  • Belgium, 
  • Cyprus, 
  • Estonia, 
  • Finland, 
  • France, 
  • Germany, 
  • Greece, 
  • Ireland, 
  • Italy, 
  • Luxembourg, 
  • Malta, 
  • the Netherlands, 
  • Portugal, 
  • Slovakia, 
  • Slovenia, and 
  • Spain. 

Ten countries (Bulgaria, the Czech Republic, Denmark, Hungary, Latvia, Lithuania, Poland, Romania, Sweden, and the United Kingdom) are European Union member states but do not use the euro. 

-----------------------------------------------------------------------------------------------------------
Sms ff bondige clips

Slovenië, Malta, Slowakije, Finland, Frankrijk, België, Oostenrijk, Nederland, Duitsland, Ierland, Griekenland, Estland, Cyprus, Luxemburg, Italië, Portugal en Spanje.
-----------------------------------------------------------------------------------------------------------