Saturday 8 December 2012

The effects of flooding in LEDCs and MEDCs


The effects of flooding in LEDCs

Problems faced in LEDCs which make the effects of flooding worse and flood management difficult:
  • Poor quality housing can't withstand flood waters
  • Poor infrastructure is easily damaged with roads, bridges and communications destroyed by flooding
  • Lack of sanitation and clean water supplies resulting in further loss of life during floods through the spread of diseases such as cholera, dysentery etc.
  • Difficult to mobilise rescue teams - lack of funding for training but made more difficult by many areas being isolated during flooding due to damage to infrastucture and inundated by flood waters;
  • Little political co-operation between the neighbouring countries - makes it difficult to reduce flood risks by tackling issues in the headwaters of the major rivers;
  • The country relies on government aid and aid from other countries - with a lack of money many necessary flood defences can not be constructed
  • In order to tackle poverty the government have focused much of their funds on improving exports - again reducing the money available for flood protection.


The effects of flooding in MEDCs

Reasons why the effects of flooding usually less severe in MEDCs and flood protection is better:
  • Homes and possessions are able to be insured against flood damage
  • Good water and sewage systems are in place providing back up supplies of clean water when local supplies become contaminated - means that disease is not the problem it is during flooding in LEDCs;
  • Good infrastructure and communication networks means it is easier to get aid and helpworkers to affected areas increasing survival through rescues and evacuation;
  • Planning restrictions are usually in place to discourage new building of houses on floodplain areas or areas prone to flooding;
  • Governments in MEDCs are able to invest more heavily in flood defence systems - including channelisation projects; the construction of artifical levees and the development of prediction and warning systems.


Friday 7 December 2012

Population distribution and population density


Population distribution

Population distribution means the pattern of where people live. World population distribution is uneven. Places which are sparsely populated contain few people. 

Places which are densely populated contain many people. Sparsely populated areas tend to be difficult places to live. These are usually places with hostile environments (example: Antarctica). Places which are densely populated are habitable environments (example: Europe).

Geographers study population distribution patterns at different scales: local, regional, national, continental and global. Patterns of population distribution tend to be uneven. For example, in the Netherlands there are more people living in the Randstad than in the rest of the Netherlands. 


Population density

Population density is a measurement of the number of people in an area. It is an average number. Population density is calculated by dividing the number of people by area. Population density is usually shown as the number of people per square kilometer.


Population density is calculated using the following formula:

Population density = total population ÷ total land area in km²


The map above illustrates the population density. The darker the colour, the greater the population density.


Factors attracting settlement
  • temperate climate (example: maritime climate)
  • low-lying flat fertile land (example: the Netherlands)
  • good supplies of natural resources (example: building resources)
  • enough drinking water
  • good infrastructure (example: high quality roads and bridges)

Factors discouraging settlement
  • extreme climates (example: arid climate)
  • mountainous or highland areas  (example: the Himalaya mountain range)
  • dense vegetation (example: the Amazon rainforest)
  • too little water (example: drought)
  • poor infrastructure  (example:  need for infrastructure improvement)

Activity at plate boundaries


Type of plate boundary

Description of changes
Earthquake / volcanic activity
Examples
Constructive zone
Two crusts / plates move away from each other.
Moderate volcanic and earthquake activity.
Mid-Atlantic ridge.
Iceland.
Destructive zone
Oceanic crust / plate moves towards continental crust / plate. The oceanic crust is heavier and sinks.
Violent volcanic and earthquake activity.
Nazca and South American plates.
Collision zone
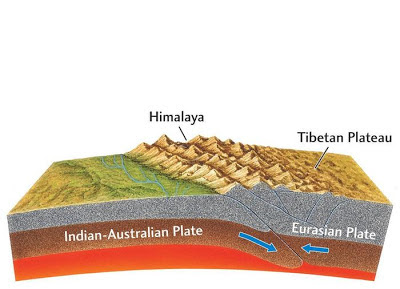
Two continental crusts / plates collide and are forced up into fold mountains.
Earthquake activity, (no volcanic activity).
Indo-Australian and Eurasian plates.
Conservative zone
Two plates move sideways past each other.
Violent earthquake activity (no volcanic activity).
Pacific and North American plates.
San Andreas, California.


Type of plate boundary
Drawing
Constructive zone


Destructive zone


Collision zone

Conservative zone


Thursday 6 December 2012

Corruption perception index

World map of the corruption perceptions index 2012 by the organisation Transparency International. The Corruption Perceptions Index ranks countries based on how corrupt a country’s public sector is perceived to be. Corruption is an abuse of entrusted power. It hurts real people every day.

Transparency International measures the degree to which corruption is perceived to exist among public officials and politicians. 

High numbers (yellow) indicate less perception of corruption, whereas lower numbers (red) an indicate higher perception of corruption.


The corruptions perception index 2012 measures the perceived levels of public sector corruption in 176 countries around the world.